Workflow Execution
Every workflow has its own dedicated execution page — a focused view for running the workflow, watching it execute live, and reviewing past runs. It lives at:
/workflow/execution/<workflow_id>
You don't navigate there by hand. From the dashboard (or anywhere a workflow is listed), click the Run button on the workflow. AutoSage opens the execution page for that workflow in the same browser tab.
This pattern is consistent across AutoSage. The Script Editor has its own single-script terminal, and the upcoming Ansible Engine will have its own execution page too. Each is tuned to what the underlying runnable actually does — workflows have multi-node graphs, so the workflow execution page is built around that.
Page layout
A typical workflow execution page looks like this:
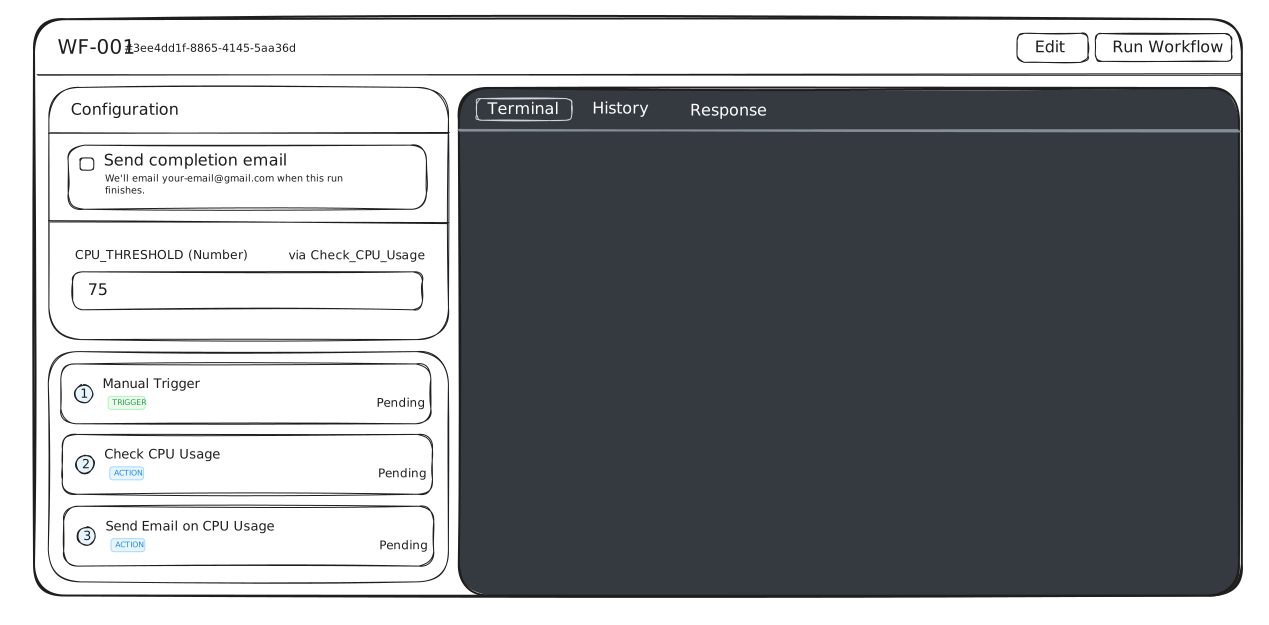
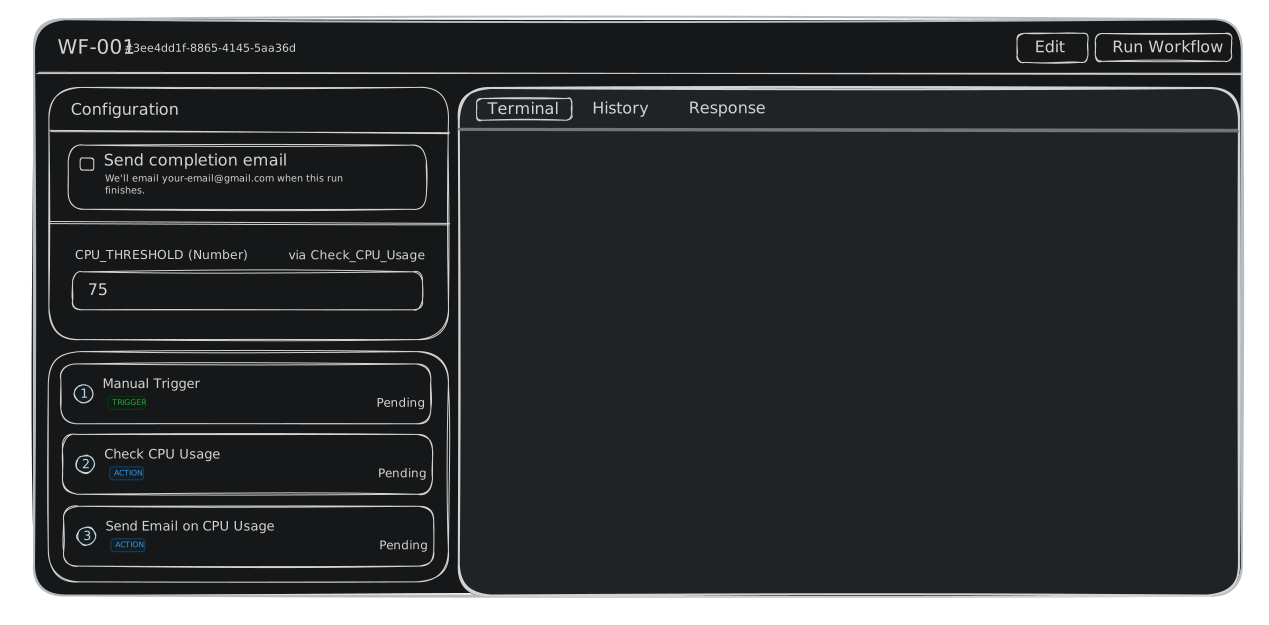
The page is split into a few distinct regions, each focused on one part of the run-and-observe loop:
- Configuration panel — set parameters and runtime options before you hit Run.
- Nodes panel — see every node in the workflow and watch its status update live.
- Live Terminal tab — streaming stdout/stderr from the currently running nodes.
- History tab — every past execution of this workflow, with log copy and export.
- Response tab — structured metadata for each past run.
The Live Terminal, History, and Response views share a tab strip so you can switch between watching the current run and reviewing earlier ones without leaving the page.
Configuration panel
Before you start a run, the Configuration panel is where you fill in everything the workflow needs to know at runtime.
- Parameters — every
{{param_name}}token declared on the workflow's nodes shows up here as an input field. Fill them in to substitute values into scripts and other configurable fields at execution time. For the full mechanics of how parameters are declared and substituted, see Parameters. - Completion email — an optional toggle. When enabled, AutoSage sends a summary email to the signed-in user's email address as soon as the run finishes, regardless of whether it succeeded or failed. The email goes to your account email — there's no separate recipient field.
Once the panel is filled in, click Run to start execution. The Nodes panel and Live Terminal begin updating immediately.
If you find yourself editing a script every time you run a workflow just to change a hostname, a version tag, or a flag, that value belongs in a parameter. The Configuration panel is built precisely so you can vary inputs per run without touching the workflow design.
Nodes panel
The Nodes panel lists every node in the workflow and acts as a live map of the run. As execution progresses, each node's status updates in place:
| Status | Meaning |
|---|---|
| Pending | The node hasn't started yet. Either upstream nodes are still running, or the run hasn't begun. |
| Running | The node is currently executing on its target server. |
| Success | The node finished without error. |
| Failure | The node returned a non-zero exit or otherwise errored out. |
| Skipped | A Decision node pruned this branch, so the node was never executed. See Decision Nodes for the branch-pruning rules. |
The panel mirrors the structure of the workflow graph, so you can correlate what you see here with what you drew in the editor canvas. It's the fastest way to answer "where is the run right now?" without scrolling logs.
Live Terminal tab
The Live Terminal tab streams the run's stdout and stderr as it happens. Output from every running node is pushed into your browser in real time, so you can watch a script's progress without waiting for it to finish.
This tab is most useful while a workflow is running. When the run completes, the same content is preserved in the History tab — so you don't need to keep the page open to review the output later.
If two Action nodes are running in parallel against different servers, both streams arrive in the Live Terminal interleaved. Each line is tagged with the node it came from so you can tell them apart.
History tab
The History tab lists every past execution of this workflow — successful, failed, or cancelled. Pick any entry to load its full captured log.
For each log you can:
- Copy the log to your clipboard — for pasting into a chat, ticket, or postmortem doc.
- Export the log as a file — for archiving or attaching to a bug report.
History is per-workflow on this page. For a cross-workflow view of every run in the account, use the dashboard's global run history.
The Live Terminal is convenient while you're watching, but it's bound to the current browser session. Anything you want to share, archive, or revisit later — pull it from the History tab.
Response tab
The Response tab is the structured counterpart to History. Where History gives you the raw log text, Response shows the metadata for each past execution:
- Run status (
success,failed,cancelled). - Start time, end time, and total duration.
- Per-node outcomes and exit codes.
- Parameter values used for that run.
- Trigger source (manual, webhook, scheduler).
Use Response when you want to compare runs at a glance — for example, "which runs used parameter env=prod?" or "how long did yesterday's nightly run take compared to today's?" — without scrolling through logs.
What's next
- Parameters — declare the inputs that show up in the Configuration panel.
- Decision Nodes — understand when a node ends up
Skippedin the Nodes panel. - Import and Export — move a workflow (and its node graph) between accounts before running it elsewhere.